The IFRC’s Unified Data Collection process gathers detailed annual data from partner National Societies on volunteers, activities, and more, to support planning and decision-making. Our team continues to support this process by analyzing workflows, expectations, and challenges, providing design guidelines, and helping develop a comprehensive online system to better capture and analyze the data.
Qualitative study: in-depth user interviews
Qualitative study: network-wide survey
Collaborative workshops
Experience journey & process maps
Extensive mockups & design systems
Wireframes of the designs done for the platform
Data visualizations for the platform, including donut and pie chats
The Challenge
Some of the challenges included navigating the complexity of gathering information from a vast and diverse global network. Reaching National Societies across different countries required thoughtful engagement to ensure participants felt comfortable sharing insights about a long-standing, institutionalized process.
Experience map, showing the summary of user interviews in several grid layers, including actors involved, experience feedback, and others.
The XD Process
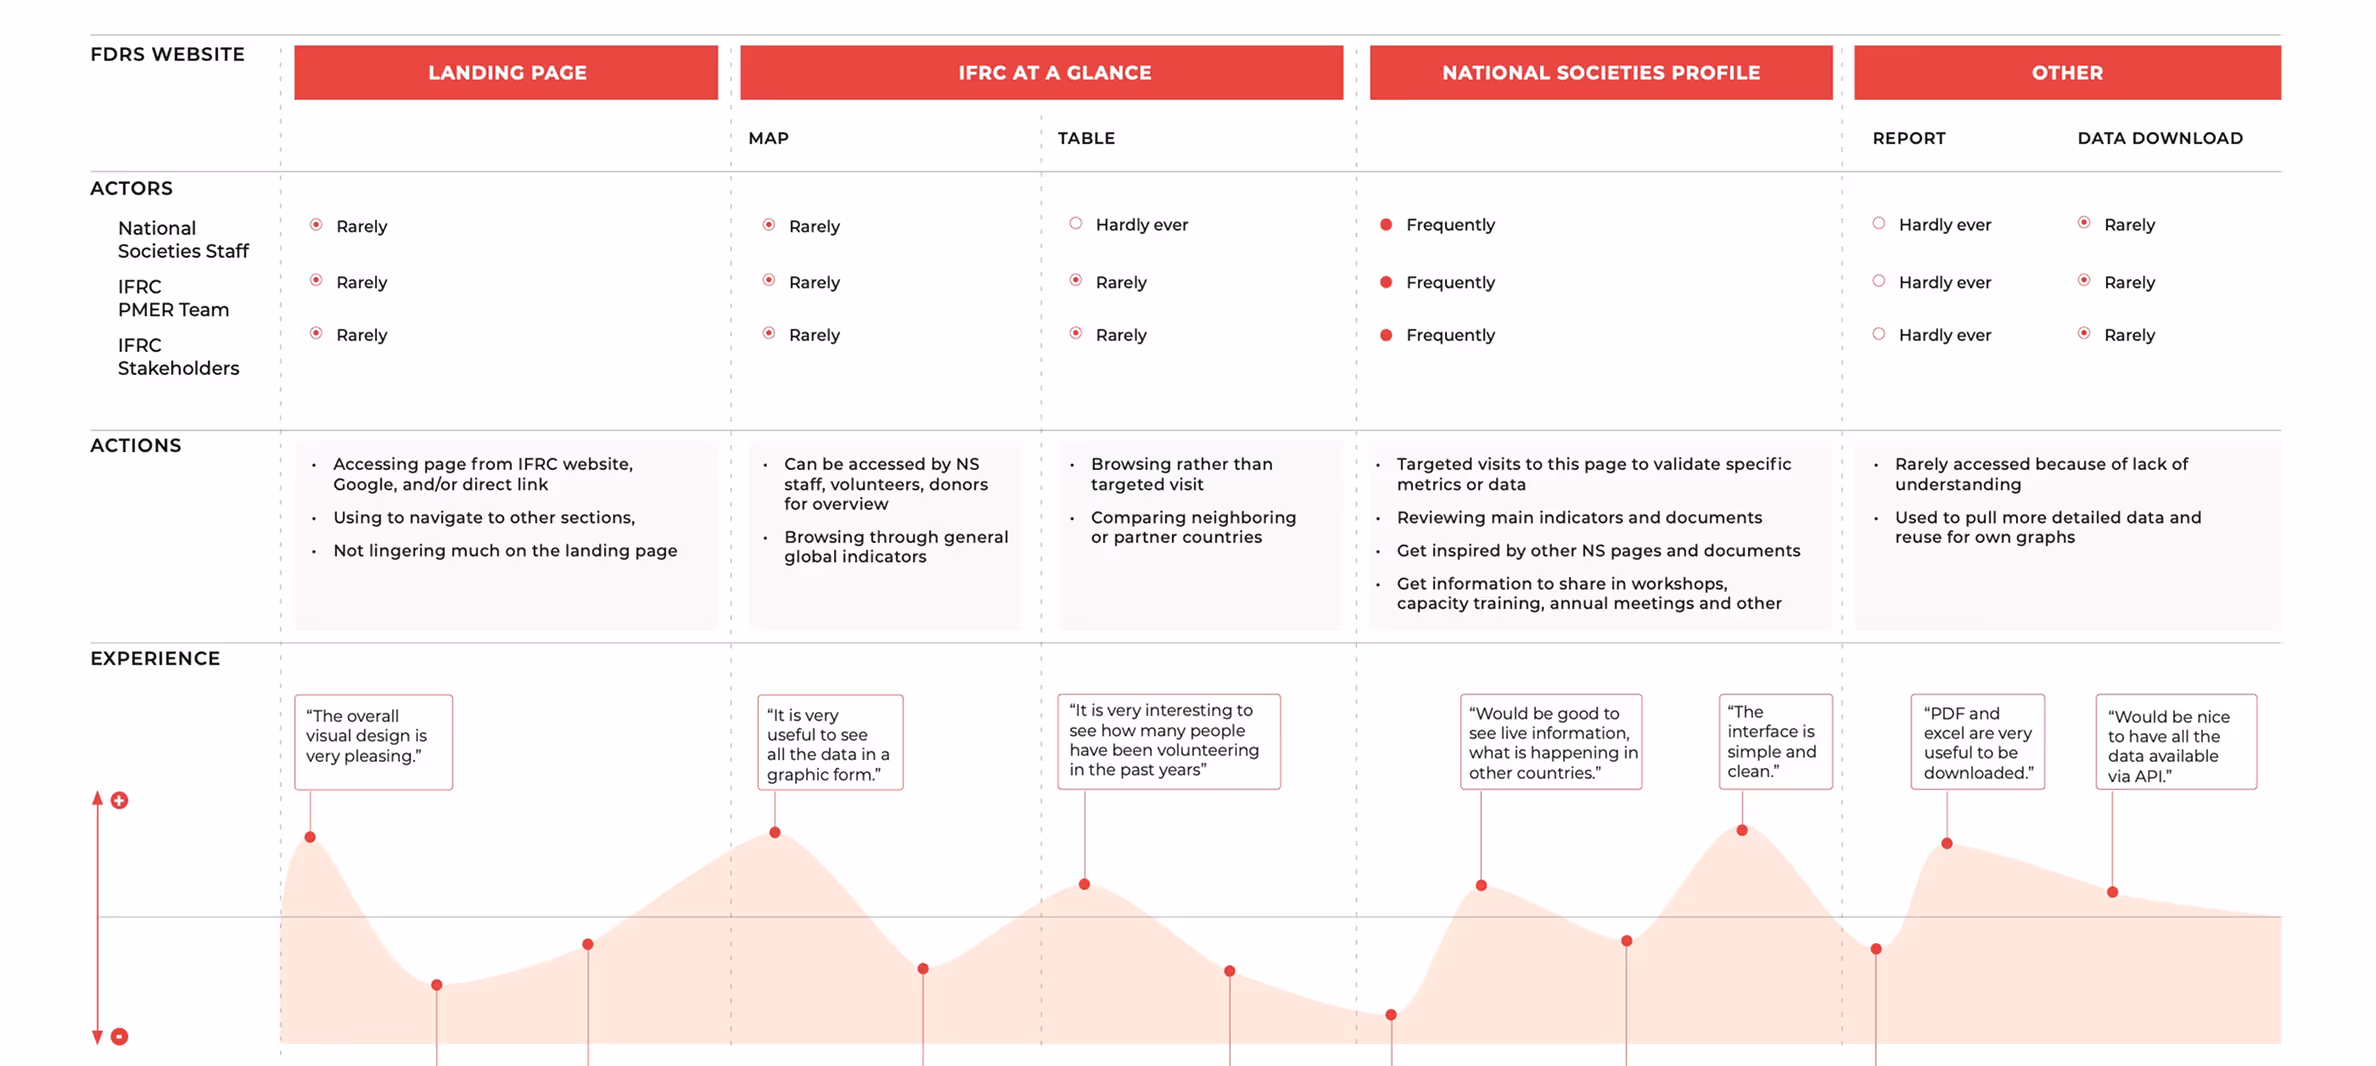
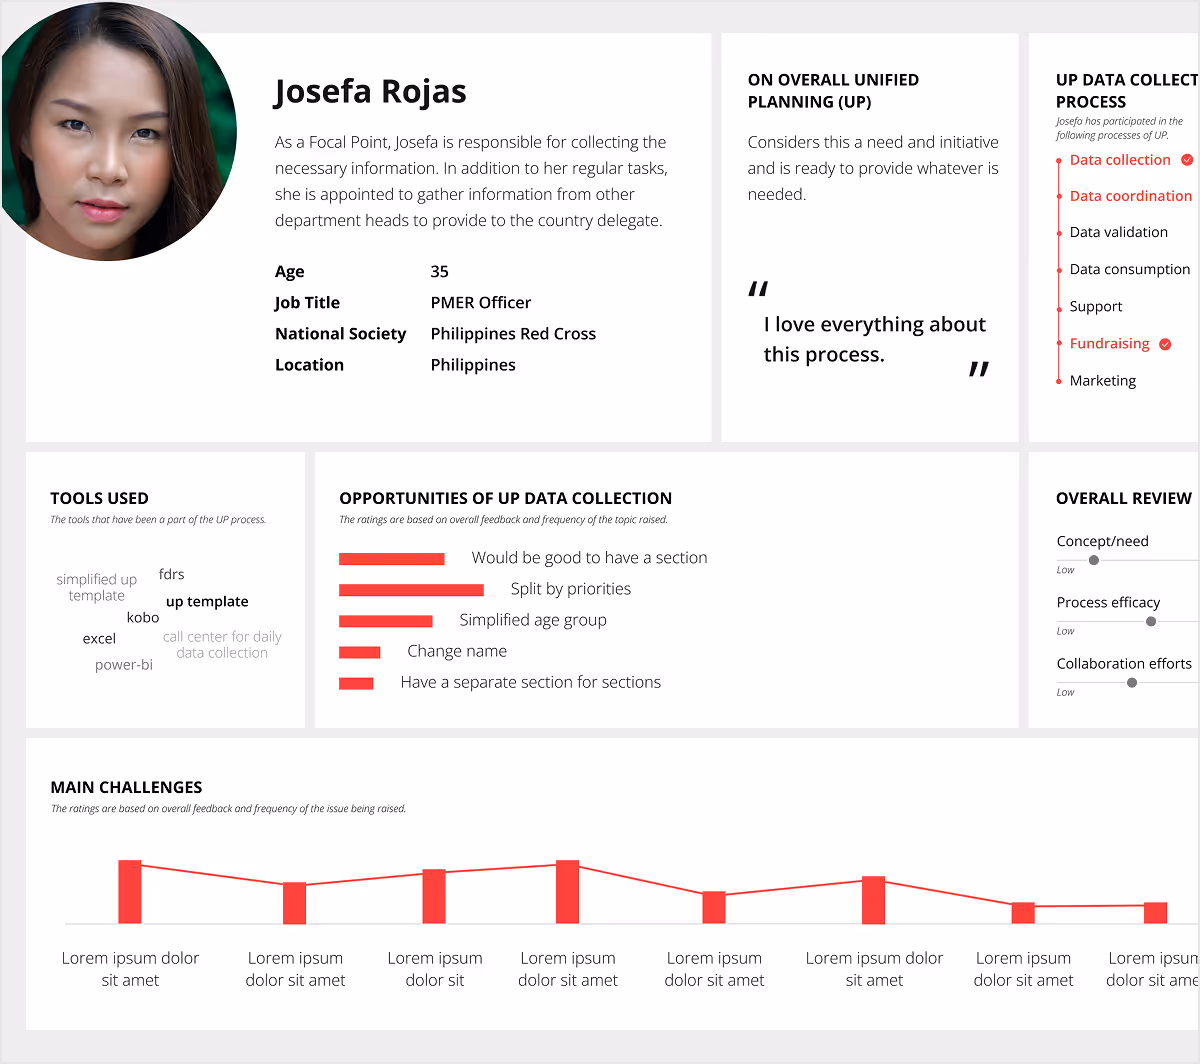
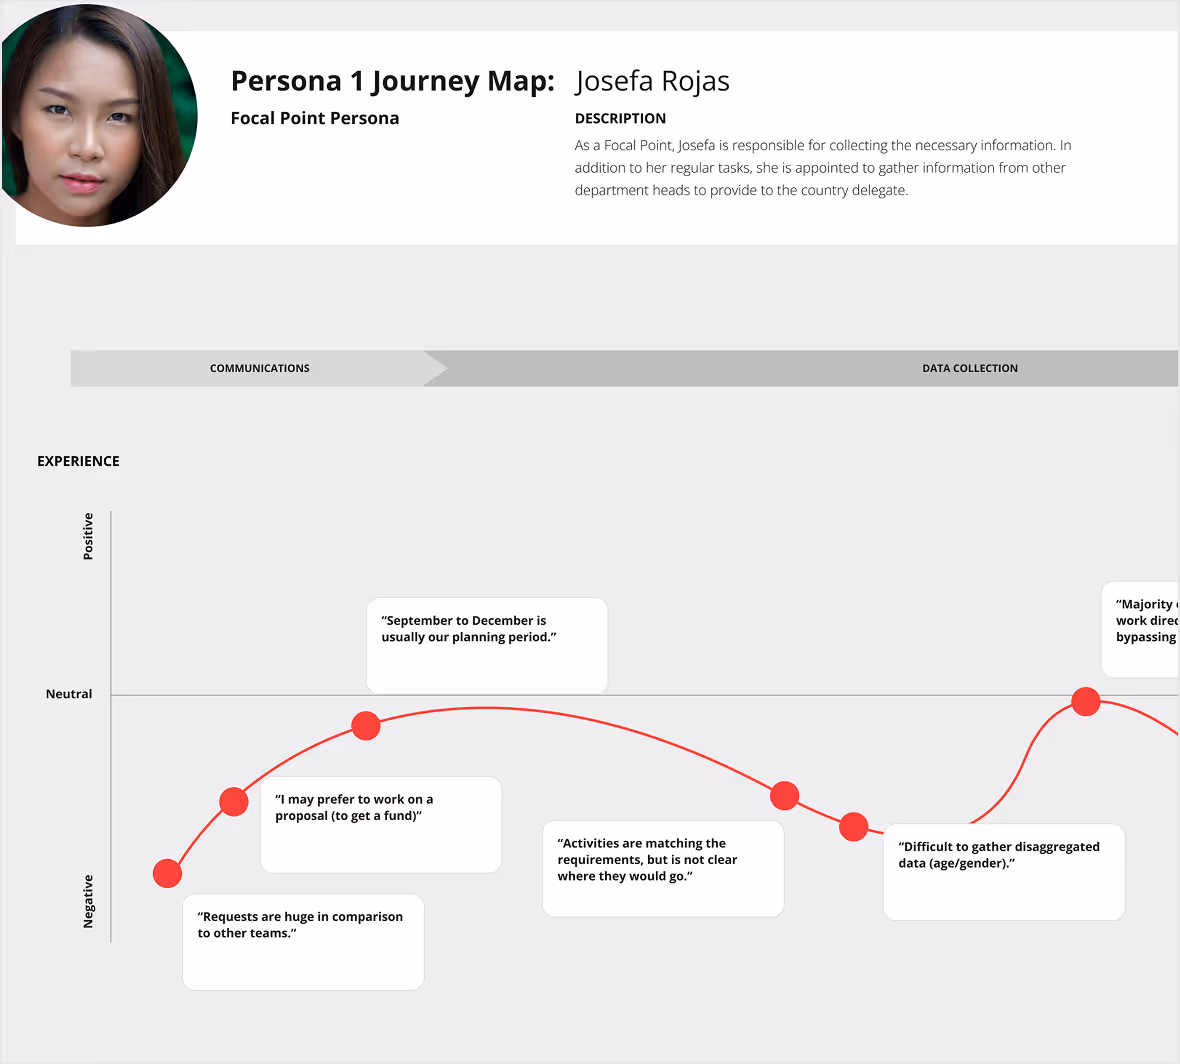
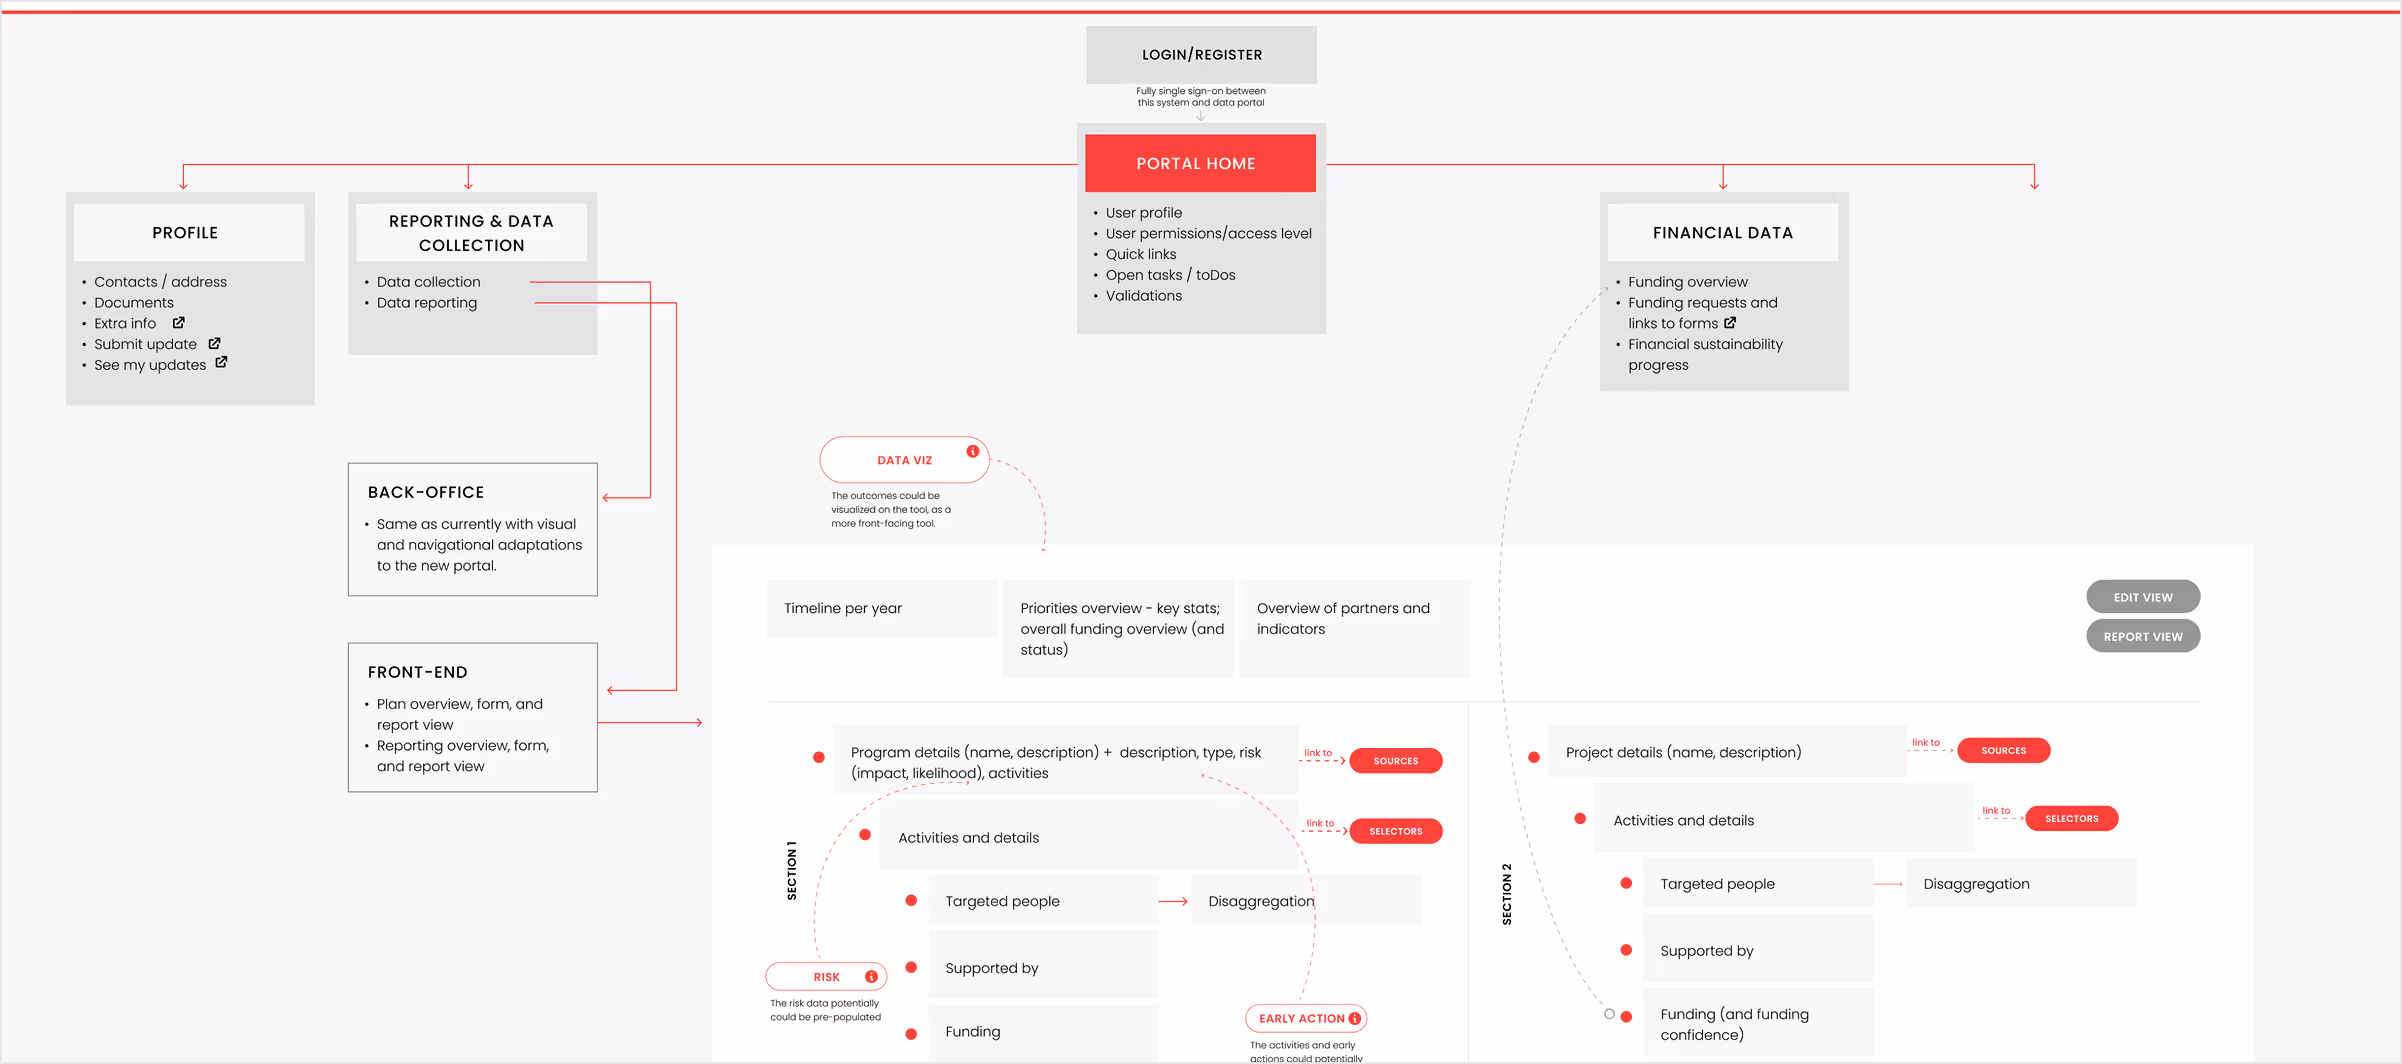
As part of the experience design process, we engaged with a wide range of participants involved in the Unified Data Collection process, gathering perspectives from across the globe through individual interviews, group sessions, and a comprehensive survey. We collaborated closely with stakeholders to analyze insights, align expectations, and co-define priorities. This work resulted in detailed visualizations of user personas, their journeys, and complete process maps that illustrated how data collection, analysis, and reporting unfold, along with key pain points and opportunities for improvement.
Persona diagram
User journey map for a specific persona
“ Working with YU transformed our approach. Their collaborative process with our team and the communities we serve resulted in solutions that truly make a difference. They brought creativity, insight, and a deep understanding of our mission, all while prioritizing inclusivity and sustainability. Thanks to their research-driven design, our platform now better meets the needs of our users."
— Emma Rodriguez, Executive Director, [Organization Name]
The Outcomes
The outcomes of our work included comprehensive diagrams mapping the full user journey and identifying key areas for improvement. We developed wireframes to demonstrate how a digital experience could streamline the process, along with detailed UI mockups and a component system aligned with IFRC’s brand and design guidelines. The envisioned tool included both a secure data collection portal and a public-facing site designed to present the breadth of gathered data in a clear, user-friendly, and impactful way.
Information architecture diagram, showing the structure of a platform
Building something bold?
We’d love to help you shape it.